
By
Frank Sortino & Hal Forsey[1]
`Would you tell me, please, which way I ought to go from here?’ `That depends a good deal on where you want to get to,’ said the Cat. Lewis Carroll
Introduction:
Some people give advice on how to manage pension fund assets. Others focus on the liabilities. We focus on the link between the two; The Desired Target Return®. If you don’t know your DTR®, you don’t know how to get from where you are to where you need to be. At any point in time the DTR is the return that must be earned on assets in order to return to a fully funded status within a designated time horizon.[i] This can be viewed as a navigation problem. Let’s assume the relevant actuarial statistics are as follows:
| Table 1 00000000 | ||||
| PV of future benefits | 60 | |||
| Assets | 60 | |||
| Discount Rate | 4.00% | |||
| Yearly Benefit | 2.832 | |||
| DTR | 4.00% | |||
| PV of | PV of | |||
| Year | Assets | total benefits | annual benefits | |
| 0 | 60 | 59.99769493 | 2.832 | |
| 1 | 59.568 | 59.45232273 | 2.723076923 | |
| 2 | 59.11872 | 58.88513564 | 2.618343195 | |
| 3 | 58.6514688 | 58.29526106 | 2.517637688 | |
| 4 | 58.1655276 | 57.68179151 | 2.420805469 | |
| 5 | 57.6601487 | 57.04378317 | 2.327697566 | |
When setting up the plan the actuary assumed a discount rate of 4% on projected liabilities and a yearly benefit ($283.2M discounted to present value at the discount rate) in order to solve for the contribution schedule on this $6 billion dollar plan (add 8 zeros). The plan is assumed to be fully funded at the top of the market in 2007, after the year 2000 high-tech sell off and the 9/11 attack on the twin towers. Table 1 indicates a DTR of 4% would maintain the fully funded status for the next five years without any further contributions.
PMPT Portfolio Construction:
We recently asked a large institutional investment advisory firm to provide us with five asset allocations for portfolios with absolute returns of 4%, 6%, 8%, 10%, and 12%.[ii] Each portfolio was constructed as described in a recent book.[iii] Figure 1 shows the portfolio we constructed for their 8% absolute return strategy, given their manager data base. We did not want to know the names of their active managers so they used a number for each category (e.g., LG – 20 is the 20th large growth manager).
Figure 1 (Absolute 8% return portfolio)

This portfolio may well have had only an 8% average using historic returns for the past few years but our methodology indicates the mean of their asset allocation using passive indexes is 9.5%. When we include their active managers when they add value and ETFs when they don’t, the mean is 12.5%. The DTR-alpha indicates their active managers could add 300 bp in any given year. The Upside potential ratio indicates the actual portfolio with active managers has 30% more upside potential than downside risk (1.3) while a totally passive portfolio would have 20% more downside risk than upside potential (.8). We believe this is useful information not contained in the Sortino ratio or Sharpe ratio. We assume this is the portfolio the plan has had for some time and they simply rebalance each year to maintain this asset mix.
Portfolio Navigation
The Portfolio Navigation strategy begins with a DTR 4 portfolio because that is the internal return that discounts the liabilities to the present value of the assets. However, this portfolio does have the potential to earn 590 basis points more than the DTR in any given year.[iv]
Figure 2 traces the results for the 8% absolute strategy (AR-8) and the DTR-Portfolio Navigation strategy (black dashed line) beginning at the top of the market in May, 2007 when the S&P 500 was at 1425 on its way to a 50% decline by February of 2009. We chose 8% as the bogey in Figure 2 because it is a popular return that actuaries assume will be earned on assets. The assumed rate of return on assets does not figure in determining the present value of the liabilities but under FAS 87 it can affect what the firm declares as profits.
Figure 2 – Fully Funded
Actively Managed (DTR) vs an 8% Absolute return
 As shown in Figure 2, whether one used Portfolio Navigation, an 8% absolute return strategy or simply bought the S&P ETF (SPY), the plan would have returned to a fully funded status in four years as indicated by the red dotted line that declines as benefits are paid each year. However, all happy endings are not the same. The absolute return strategy was down 32% when the market finally bottomed while the DTR strategy was only down 11.7%. Also, the DTR strategy is more than a billion dollars better off after four years. How was this achieved?
In Figure 2 the DTR was calculated at the end of every quarter and when the asset value reached $5.77B the DTR increased to 6%. At that point the allocation to equity was increased from 30%, as given in the 4% portfolio, to 45% in the 6% portfolio. Importantly, this change was not due to an economic forecast or some market timing strategy. Based on the funding status, it was the return calculated to return to a fully funded status within a 5 year interval. Five years is not a magic number that must be used in portfolio navigation. We did so, so as not to be accused of making propitious changes with 20/20 hindsight. We chose it before conducting the study and purposefully did not try other intervals. In practice we would present the plan sponsor with other options.
Less than a year later the pension assets were down another $470 M and the DTR was calculated as 8% as shown in Figure 2. Again, in less than a year, the DTR was calculated to be back to 4%. Would a pension fund have been willing to make such changes, buying as the market crashed and selling as the market recovered. Well, that’s better than doing the opposite. Of course, the pension committee would have to make that decision each time the DTR changed and they would want some evidence to support the decision. This study is intended to provide that evidence.
The Underfunded Case
What if the pension plan was underfunded at the beginning of this study? Figure 3 illustrates the results if the plan had a shortfall in May of 2007. All the statistics in Table 1 were kept constant except the pension assets were assumed to be $5.37 B. In this example the plan would return to fully funded status if it earned 6% for the next 5 years. This time we compare Portfolio Navigation (black dashed line) to absolute return strategies of 4%, 6%, 8%, 10% and 12%. All absolute strategies are rebalanced annually. The DTR- Portfolio Navigation strategy begins with a DTR of 6% and changes three times over the next four years.
After four years none of the strategies has succeeded in returning to a fully funded status. Portfolio Navigation does not guarantee success anymore than navigation aids for air travel guaranty one will reach their destination. In both cases it is a matter of improving your odds of success. Navigation has steadily improved over the decades to become a reliable science.[v] We are a long way from that level of reliability. What if the market never recovered? What if the airplane crashes? Risk is situation specific. The way one should measure the risk of flying is not appropriate for measuring the risk of investing in financial markets. We have set forward in books and papers what we believe to be an improvement in the way to calculate risk and reward when investing. This paper describes a way to use these improvements as tools to navigate from where a pension plan’s assets are to where they need to be over a prescribed time horizon.
[1] Frank Sortino is Professor Emeritus in Finance and Hal Forsey is Professor Emeritus in Mathematics from San Francisco State University, California.
Figure 3 – Under Funded
(DTR® vs Absolute Return Strategies)

The reason the DTR strategy stays at 8% for the last two years is that time is running out in the initial 5 year horizon. Of course the pension committee could decide to reset the time horizon to 3 years or more in May of 2011. The operative questions are: as fiduciaries, do they know how much risk they will be taking to get from where they are ($5.58 B) to where they want to be ($5.7 B) in just one more year? Is that too much risk? Should they start making contributions and/or increase the time horizon? These are questions that have an answer, if you have the right tools.
Throughout this study we have assumed the goal was to fund the plan within the cost constraints provided by the actuary. The investment objective then became, maximize the potential to exceed the DTR relative to the risk of falling below the DTR. What if the goal was to maximize the excess return of the assets over the current costs in order to increase earnings? Even so, there is still some return that must be earned in order to accomplish that goal and the investment objective remains the same. It is simply another application of Portfolio Navigation for another Desired Target Return®.
Conclusions:
- Constructing a portfolio around the assumed actuarial return on assets ignores the link between pension assets and pension liabilities. Therefore, constructing a portfolio around that link, the DTR®, makes more sense. Likewise, the mean and standard deviation and beta are also unrelated to the link between assets and liabilities.
- Absolute return strategies come in many forms. Some attempt to minimize the risk of falling below a specific return that may or may not be related to the funding ratio and totally ignore the upside potential. We have written our opinions about this subject on our blog, pmpt.me (see, “Absolute Nonsense”).
- Portfolio navigation outperformed a wide range of absolute return strategies with less downside risk during one of the worst stock market periods in our history.
- It also outperformed all absolute return strategies when the plan was underfunded and began with a 6% DTR or 8% DTR (available on our website download folder).
- Maintaining the same asset mix by rebalancing may have been appropriate in bygone years, but not in today’s volatile markets. In the last twelve years we have witnessed three major disruptions in the financial markets and we are still suffering from the last one. We believe it is time to find a new way to reach your destination. This study offers a way to accomplish this with less risk in a manner that is understandable.
[i] This could be calculated by any actuarial firm as the internal rate of return that discounts the projected liability stream to present value. All we are using in this study is the statistics shown in Table 1.
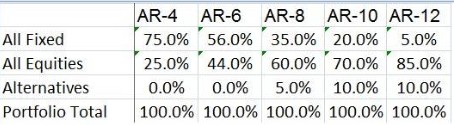
[ii] These are the asset allocations provided:
[iii] “The Sortino Framework for Constructing Portfolios,” Elsevier Publishing 2010 (see Amazon.com).
